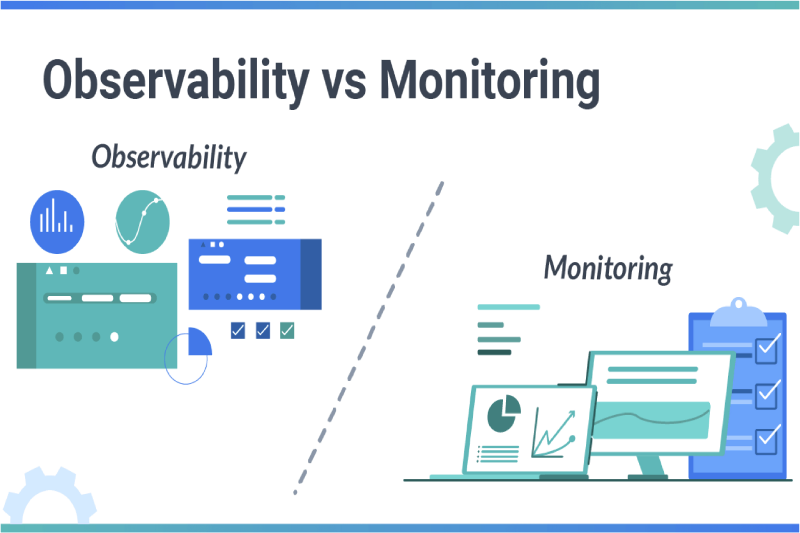
Modern systems are complex (microservices, cloud-native apps, and real-time data flow make it harder to understand what’s happening inside. Traditional monitoring tells you when something breaks, but not why.
In this guide, we’ll breakdown why observability matters, how observability in DevOps differs from monitoring, and the best tools and practices to enhance system reliability and performance.
1. What is observability in DevOps?
As modern applications become more dynamic and distributed, understanding system behavior in real time is essential. Observability DevOps provides a deeper, more proactive approach than traditional monitoring, helping teams diagnose issues, optimize performance and maintain reliability.
In DevOps, observability helps teams understand system behavior by analyzing logs metrics, traces, and events. Unlike traditional monitoring, which focuses on fixed alerts, observability gives deeper insights, allowing teams to explore, troubleshoot, and uncover hidden issues in real time.
Key component of observability DevOps:
- Metrics: Numeric data that track system health (e.g., CPU usage, request latency).
- Logs: Detailed records of events and errors that provide context to incidents.
- Traces: Detailed records of events and errors that provide context to incidents.
- Events: System changes or actions that impact performance and reliability.
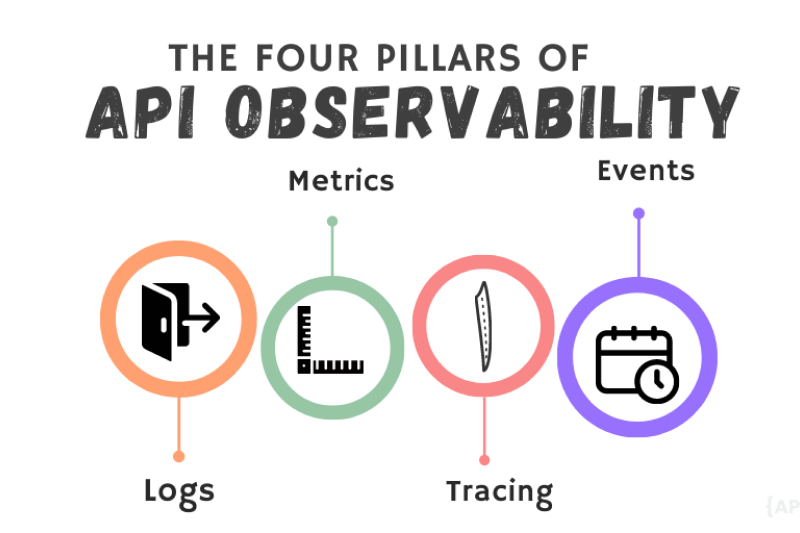
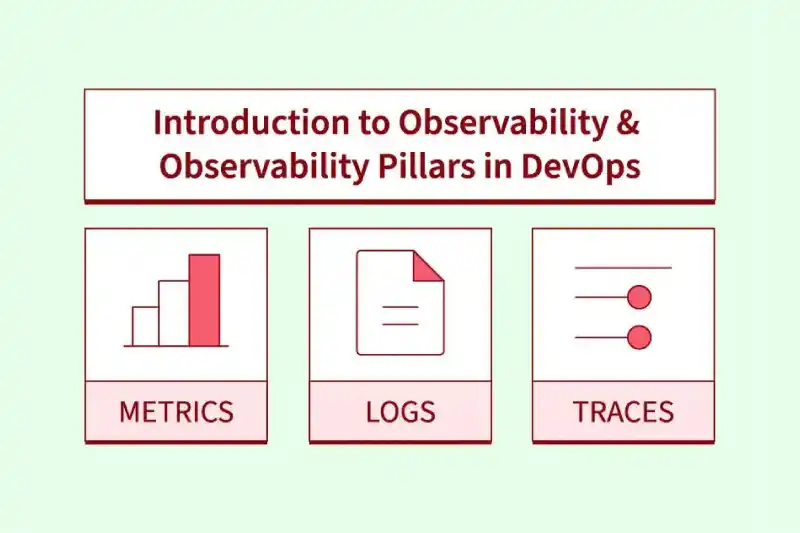
2. The four pillars of observability
Observability in DevOps is built on four key pillars: metrics, logs, traces, and events. Each plays a crucial role in providing a complete view of system performance and behavior. While traditional monitoring focuses on isolated data points, these four components work together to help teams detect, diagnose, and resolve issues faster.
Let’s breakdown each pillar and how it contributes to a more reliable and resilient system.
2.1 Metrics
Metrics are the backbone of observability, offering quantitative insights into system performance and health. They provide structured, real time data that DevOps teams can analyze to detect trends, identify anomalies, and optimize system behavior. Unlike logs and traces, which capture detailed contextual information, metrics give a high level snapshot of how well a system is functioning.
Key metrics in DevOps observability include:
- Response time: How fast your system processes requests; slow responses frustrate users.
- Error rate: The percentage of failed requests; a sudden spike signals trouble.
- Resource utilization: CPU, memory, and disk usage; inefficient allocation can lead to slowdowns.
- Request latency: The delay between request and response; even milliseconds matter.
2.2 Logs
If metrics give you a high level view of your system’s health, then logs are where the real story unfolds. Think of them as a detailed record of everything happening inside your system (who did what, when and how). Whether it’s a failed database query, an unauthorized login attempt, or a sudden service crash, logs capture every action, error, and anomaly in real time.
For DevOps engineers, logs are invaluable when it comes to troubleshooting and root cause analysis. When something breaks, metrics might tell you that error rates have spiked, but logs show you exactly what led to failure (the sequence of events, specific error messages, and system behaviors) before things went wrong.
They help teams:
- Diagnose issues faster: Instead of guessing, you can pinpoint the exact error and its cause.
- Identify recurring patterns: Spot trends in performance degradation or security threats before they become critical.
- Reconstruct system behavior: Understand what happened step-by-step leading up to an incident.
But here’s the catch: not all logs are created equal. Poorly structured, unindexed, or excessive logs can be just as frustrating as not having any at all. That’s why log management best practices, like centralized logging, log levels (INFO, DEBUG, ERROR), and proper retention policies, are crucial for keeping logs useful rather than overwhelming.
2.3 Traces
In modern microservices and cloud-based architectures, a single request can pass through multiple services, databases, and APIs before completing. Traces help track that journey from start to finish, showing where time is spent, where delays happen, and how services interact.
This is why tracing is essential. With distributed tracing, you get a step-by-step breakdown of how a request flows through your system. It helps you:
- Spot performance bottlenecks: Find out which service is slowing things down.
- Uncover latency issues: See exactly where requests are getting stuck.
- Understand dependencies: Map out how services interact and impact each other.
Without tracing, debugging distributed systems feels like searching for a needle in a haystack. With it, you get clear visibility into request flows, making it easier to optimize performance and resolve issues faster.
2.4 Events
Every system experiences critical moments (a new deployment, a configuration update, a security alert). These events capture those key changes, giving DevOps teams the context they need to understand what’s happening and why.
Unlike metrics and logs, which track performance and errors, events focus on significant system changes. They help teams:
- Monitor deployments: See how code changes impact performance.
- Track configuration updates: Identify misconfigurations before they cause issues.
- Detect security incidents: Get real-time alerts on suspicious activity.
Events provide the missing puzzle piece when diagnosing issues. By correlating events with metrics, logs, and traces, teams can quickly pinpoint the root cause and take action before small issues become big problems.
3. 3 Types of monitoring in DevOps
Monitoring in DevOps is about ensuring everything runs smoothly, efficiently, and without disruptions. From servers and networks to applications and user experience, each layer requires a different approach to catch potential issues before they escalate.
To get a complete picture, monitoring is typically divided into three key areas.
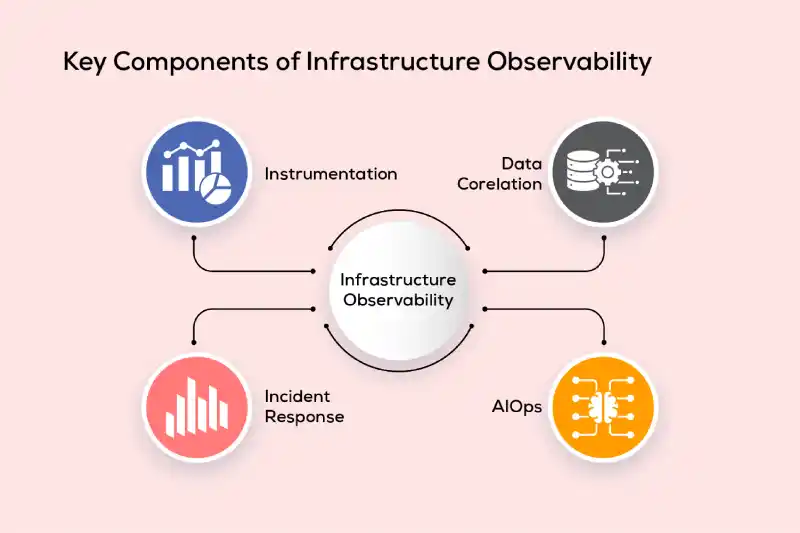
3.1 Infrastructure monitoring
Infrastructure is the foundation of any application, and keeping it healthy is critical. Servers, networks, and databases must be continuously monitored to ensure availability, performance, and stability. A single failure in infrastructure can lead to downtime, slow performance, or even data loss.
By tracking CPU usage, memory consumption, disk I/O, network traffic, and database health, teams can identify potential failures early, optimize resource allocation, and prevent costly outages.
3.2 Appication monitoirng
Even if the infrastructure is stable, an application can still fail, slow down, or behave unexpectedly. Application monitoring focuses on tracking the performance, response times, error rates, and service dependencies of software systems.
With real-time insights, DevOps teams can quickly detect performance bottlenecks, troubleshoot failures, and ensure a seamless experience for users. Whether it’s a backend API, a microservice, or a front-end web app, application monitoring helps keep everything running smoothly.
3.3 User monitoring
At the end of the day, user experience is what truly matters. User monitoring focuses on tracking how real users interact with an application, where they drop off, what slows them down, and what frustrates them.
By analyzing session recordings, heatmaps, and user journeys, teams can identify pain points, improve user flows, and optimize the application to enhance engagement and retention. This type of monitoring ensures that technical performance translates into real-world usability.
4. Why is observability important in DevOps?
In DevOps, keeping systems fast, reliable, and resilient is a constant challenge. Issues can rise from anywhere (a failing microservice, a slow database query, or an unexpected traffic spike. Without deep visibility, teams often struggle to detect problems before users are affected.
Observability solves this by providing real time insights into system behavior, helping teams optimize performance, respond to incidents faster, and continuously improve their applications.
4.1 Improving system performance and reliability
Performance bottlenecks can be hard to catch, especially in distributed architectures. Observability helps teams:
- Pinpoint slow services or inefficient resource usage before they degrade performance.
- Optimize infrastructure costs by tracking real-time resource consumption.
- Proactively detect anomalies, reducing the risk of major failures.
With observability DevOps, small issues get fixed before they become system-wide outages.
4.2 Accelerating incident response
When something goes wrong, every second counts. Observability tools provide real-time alerts, detailed logs, and traceable event histories, enabling teams to:
- Detect incidents faster, minimizing downtime.
- Diagnose root causes quickly, without guesswork.
- Implement fixes efficiently, reducing impact on users.
Instead of reacting after users complain, teams can resolve issues before they notice.
4.3 Enabling continuous improvement
Observability is a powerful tool for continuous improvement. By analyzing historical trends, performance data, and system interactions, teams can:
- Refine system architecture based on real-world insights.
- Improve CI/CD pipelines, catching regressions early.
- Make data-driven decisions for future optimizations.
5. Best observability tools for DevOps
Choosing the best observability tools for DevOps engineers can make all the difference in how well DevOps teams monitor, troubleshoot, and optimize their systems. From tracking performance metrics to analyzing logs and tracing requests, these tools help ensure smooth operations and quick issue resolution. Here are some of the most widely used observability tools for DevOps:
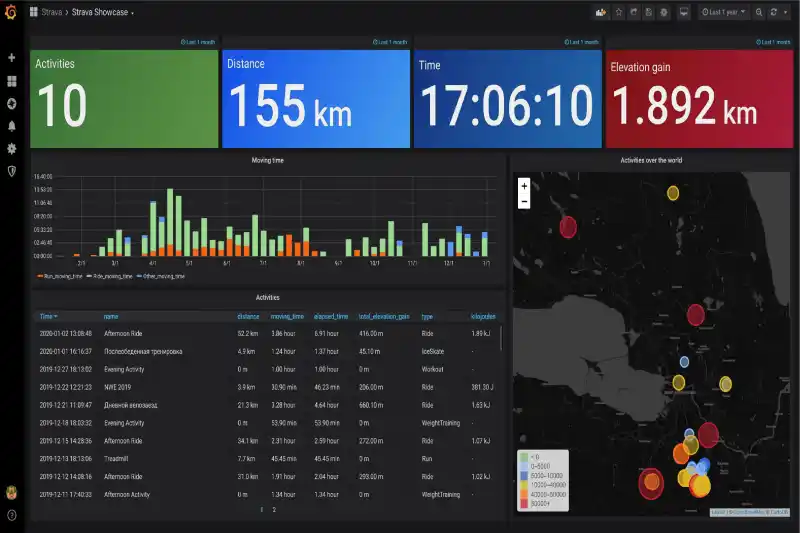
5.1 Prometheus and Grafana
Prometheus is one of the most popular open-source monitoring tools, designed to collect and store time-series data like CPU usage, memory consumption, and request rates. It’s widely used because of its scalability and flexibility in tracking system health.
Grafana works alongside Prometheus, providing beautiful, interactive dashboards that make it easier to visualize system performance. Together, they offer a powerful combo for real-time monitoring and alerting in DevOps environments.
5.2 ELK Stack (Elasticsearch, Logstash, Kibana)
If you’re dealing with large volumes of logs, the ELK Stack is a great choice. It includes:
- Elasticsearch: A fast search engine that helps query log data efficiently.
- Logstash: A tool for collecting, processing, and transforming logs.
- Kibana: A dashboarding tool for visualizing log data in real time.
By combining these three, DevOps teams can search, analyze, and make sense of system logs, helping with troubleshooting, security monitoring, and performance optimization.
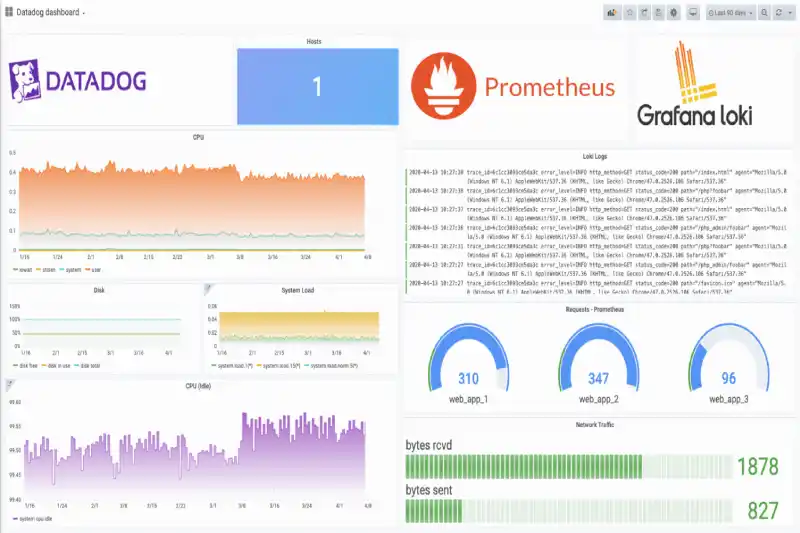
5.3 Datadog
For those looking for a comprehensive, cloud-based observability solution, Datadog is a popular choice. Datadog is widely used because of its ease of integration with cloud services and its user-friendly dashboards that give teams full visibility into their infrastructure and applications.
It provides:
- Metrics monitoring (like Prometheus)
- Application Performance Monitoring (APM) (to track request flows and dependencies)
- Log management (similar to ELK)
5.4 Jaeger
Then working with microservices, it’s crucial to know how requests move through different services. Jaeger helps with distributed tracing, allowing teams to:
- Visualize request flows across services.
- Identify latency issues and bottlenecks.
- Improve performance by understanding dependencies.
It’s an essential tool for teams dealing with complex architectures where pinpointing slow services is a challenge.
6. How to implement observability in DevOps
Observability isn’t about simply collecting data but about gaining real insights into how your system behaves, so you can detect, debug, and optimize performance in real time. A well-executed observability strategy empowers teams to proactively address issues, enhance system reliability, and deliver a seamless user experience.
But how do you implement observability effectively? Let’s explore best practices and common challenges in implementation.
6.1 Best practices for setting up observability
To implement observability for DevOps successfully, you need a structural approach that covers data collection, tool selection, monitoring, and integration into your development workflow.
Step 1: Instrument your applications and systems
Observability starts with capturing the right data. This involves instrumenting your applications, infrastructure, and services to collect:
- Metrics: Track system health indicators like CPU usage, memory consumption, response times, and error rates.
- Logs: Record event data for debugging and root cause analysis.
- Traces: Follow request flows across microservices to identify ottlenecks and dependencies.
Step 2: Choose the right observability tools
Selecting the right tools depends on your system architecture and observability needs.
|
Observability component
|
Recommended tools
|
|
Metrics Monitoring
|
Prometheus, Grafana
|
|
Log Aggregation & Analysis
|
ELK Stack (Elasticsearch, Logstash, Kibana), Splunk
|
|
Distributed Tracing
|
Jaeger, OpenTelemetry
|
|
End-to-End Monitoring
|
Datadog, New Relic, Dynatrace
|
Step 3: Set up dashboards & smart alerts
Observability is only useful if you can act on the data efficiently. Here’s how:
- Create intuitive dashboards that provide a real-time view of system performance.
- Define actionable alerts based on meaningful thresholds (avoid alert fatigue by tuning sensitivity).
- Use anomaly detection & AI-based alerting to identify unusual patterns before they cause major incidents.
Step 4: Integrate observability into your CI/CD pipeline
Observability shouldn’t be limited to production, it should be embedded into the software development lifecycle. By integrating it into your CI/CD pipeline, you can:
- Detect performance regressions early in staging environments.
- Monitor new deployments and track their impact on system health.
- Enable automatic rollbacks if critical failures occur post-deployment.
6.2 Overcoming common challenges in observability
While observability is essential, implementing it effectively comes with challenges. Here’s how to tackle them.
- Data overload: Focus on key metrics, filter logs, and use retention policies to avoid unnecessary data storage.
- Legacy systems: Start with basic log aggregation, use adapters for integration, and standardize with OpenTelemetry.
- Security and privacy: Apply role-based access control (RBAC), encrypt logs, and mask sensitive data.
- Observability culture: Encourage cross-team collaboration, train developers, and use observability insights to improve system reliability.
7. Conclusion
Observability is key to system reliability, performance, and resilience in modern DevOps. It enables faster issue detection, smarter decision-making, and smoother deployments.
Let Stepmedia Software help you implement the right tools and best practices to unlock real-time insights and drive efficiency. Contact us today to get started!